NovaFit - Google Ads and Meta Ads performance monitoring
NovaFit runs ads on Google Ads and Meta Ads at the same time, and before this system the campaigns were checked by hand - in two ad accounts, one after the other, whenever somebody found the time. Now every morning the system pulls yesterday’s numbers from both ad accounts on its own, drops them into a Google Sheet with a ready-made dashboard, compares every campaign with its own median for the week and, if CPA or ROAS crossed a threshold, says so in Telegram. An expensive day shows up the next morning, not at the end of the month.
Who it fits: any business spending real money on ads across two or more channels - online stores, fitness clubs, schools, clinics, subscription services. Especially those with no analyst on staff whose agency sends a report once a month.
Stack: Python, connectors to the Google Ads API and the Meta Marketing API, the Google Sheets API as both storage and dashboard, aiogram for the Telegram bot and APScheduler for the daily run.
- Python
- Google Ads API
- Meta Marketing API
- Google Sheets API
- aiogram
- APScheduler
How the system is put together
Three parts, one sheet. The Google Sheet is both the storage and the dashboard: the daily campaign rows land in it, and the styling, formulas and charts live right there. The detection module reads those same rows and decides whether anything deviates. The Telegram bot shows summaries on request and sends out new alerts. Every morning at 09:00 Kyiv time the scheduler runs the whole chain: fetch yesterday from Google Ads and Meta Ads - write - recalculate - check - notify.
The numbers come straight from the ad accounts: a Google Ads API connector pulls the daily campaign metrics from Google, a Meta Marketing API connector pulls them from Meta. Both sit behind one interface with a single method - return the metric rows for a period - so a third channel, say TikTok Ads, is one more class, while the storage, detection, bot and sheet styling stay untouched.
1. The dashboard in a Google Sheet
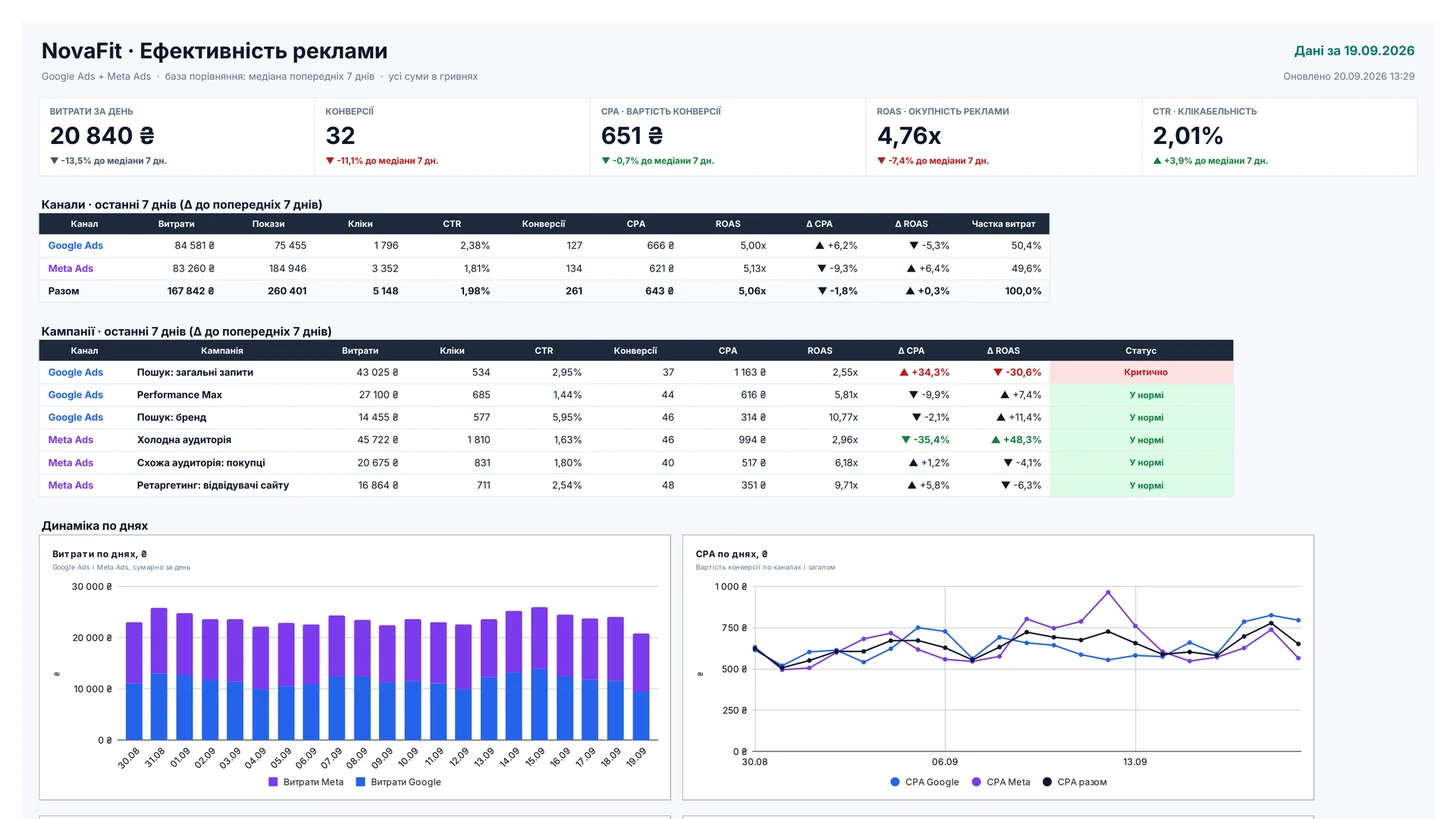
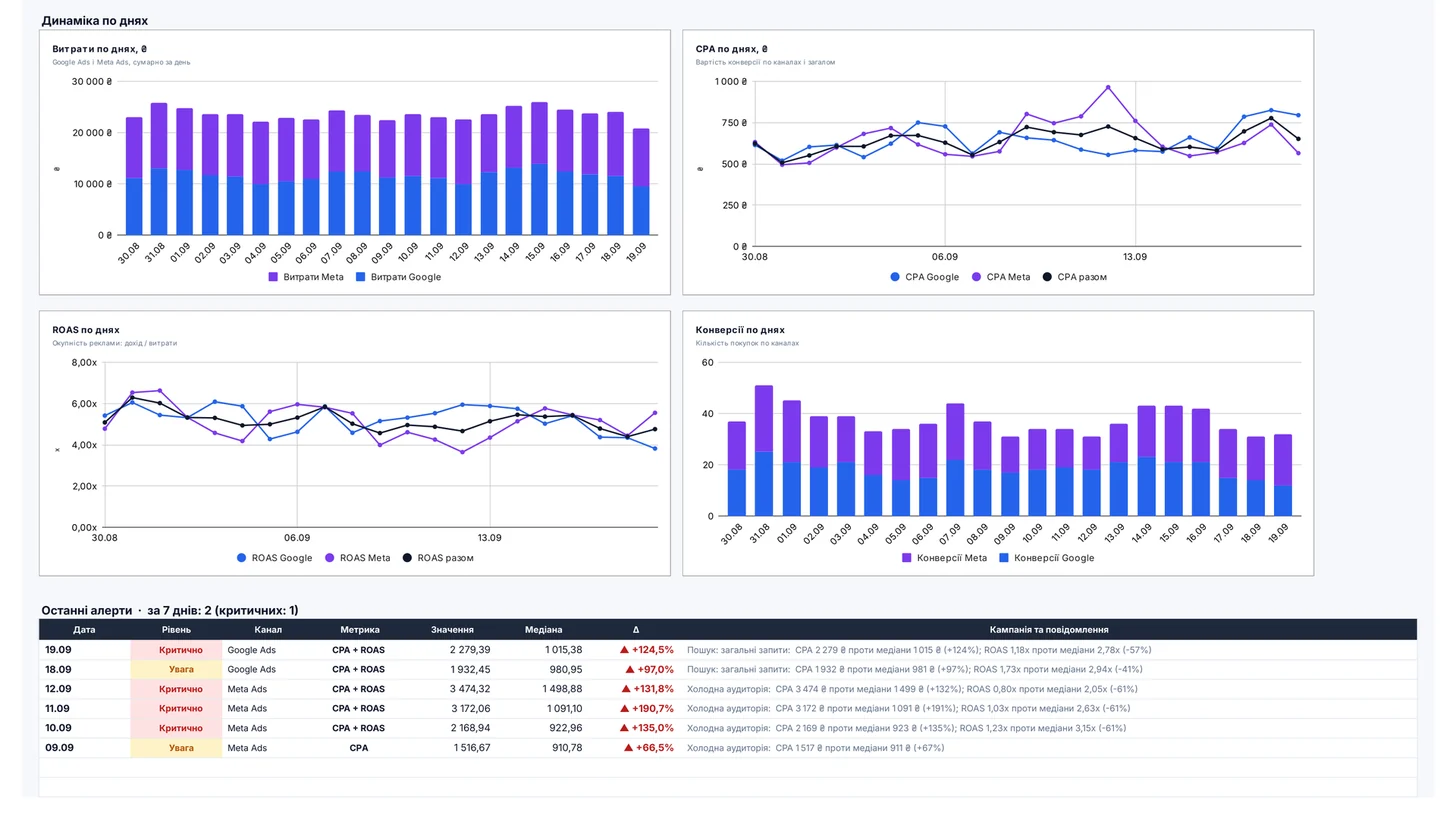
The dashboard sheet is laid out for a 1920x1080 screen so it can be opened on an office monitor or TV without scrolling. At the top - five KPIs for yesterday (spend, conversions, CPA, ROAS, CTR), each with its deviation from the 7-day median. Below - a channel summary and a campaign table: spend, clicks, CTR, conversions, CPA, ROAS, the change against the previous week and a status of either normal or critical.
Then four daily charts - spend, CPA, ROAS and conversions, each split into Google / Meta / total - and the log of recent alerts. There is no separate BI tool and no licence: the client opens an ordinary sheet in their own account and can filter, copy or export whatever they need. The locale is Ukrainian: amounts in hryvnia, a decimal comma, dd.mm.yyyy dates.
2. Data and formulas
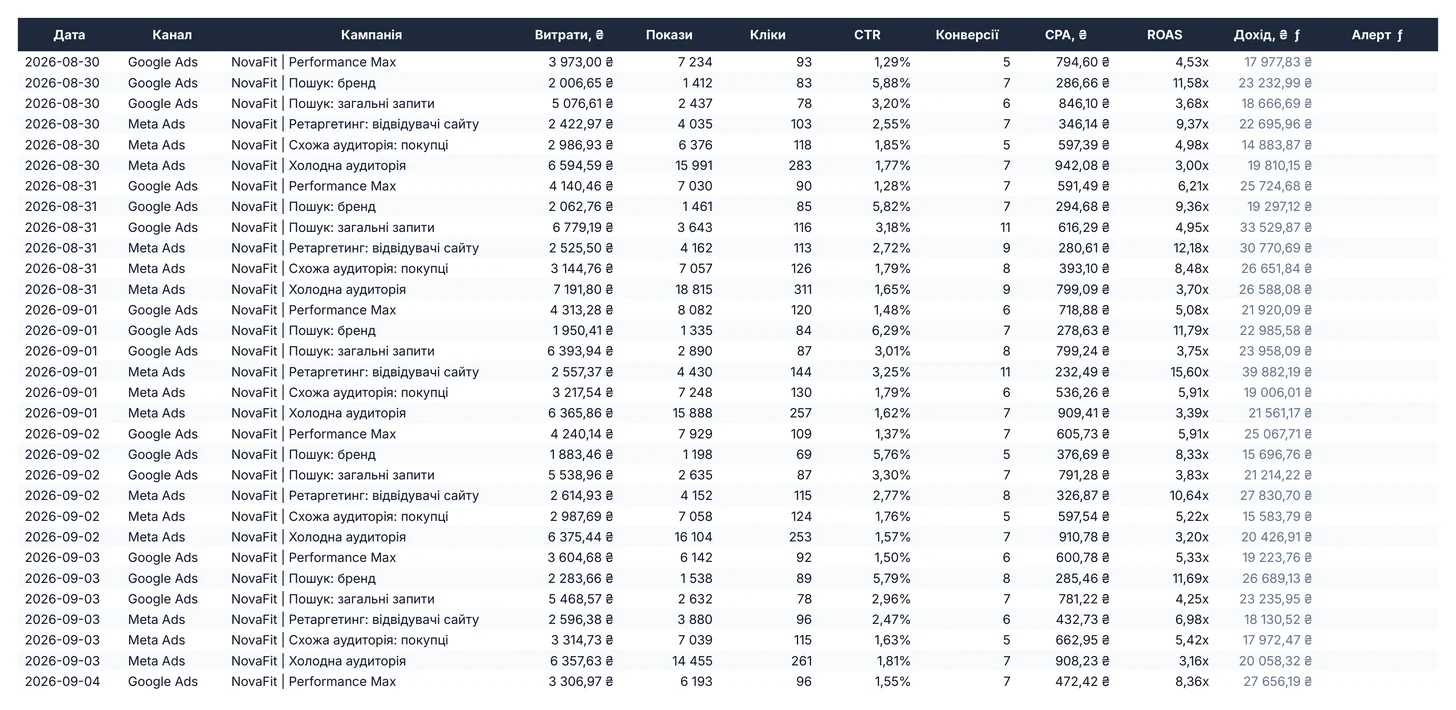
Under the dashboard sit three working sheets. The data sheet holds one row per campaign per day with every metric; revenue and the alert flag are calculated by formulas rather than written by code, so any figure can be checked with a click. The daily sheet rolls those same rows up into per-day aggregates for Google, Meta and both. The alerts sheet is the anomaly log with the date, level, value, median and message text.
3. How anomalies are caught
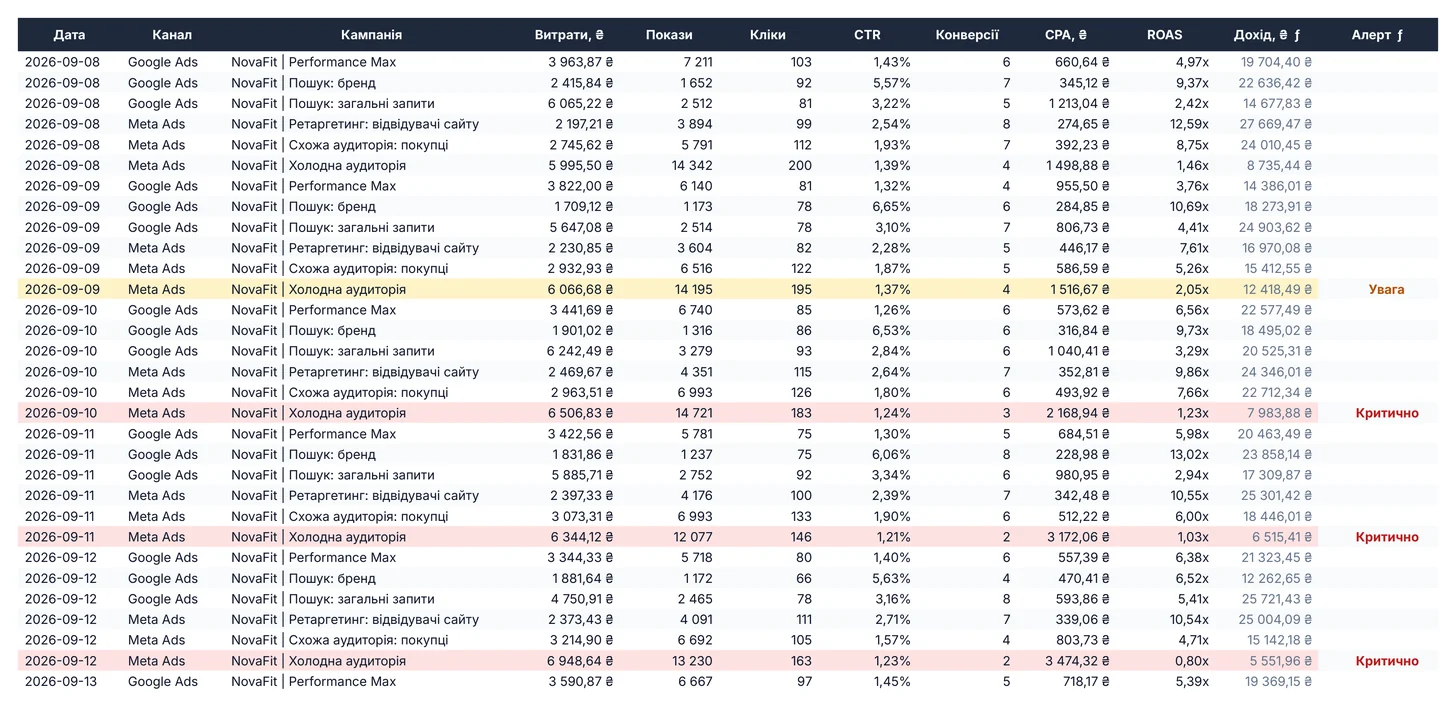
For every campaign and every day the system takes the median CPA and ROAS of the 7 previous days - the current day is left out of the window - and compares the current value against it. The median rather than the mean on purpose: one anomalous day inside the window does not shift the baseline, so the system never gets used to bad numbers.
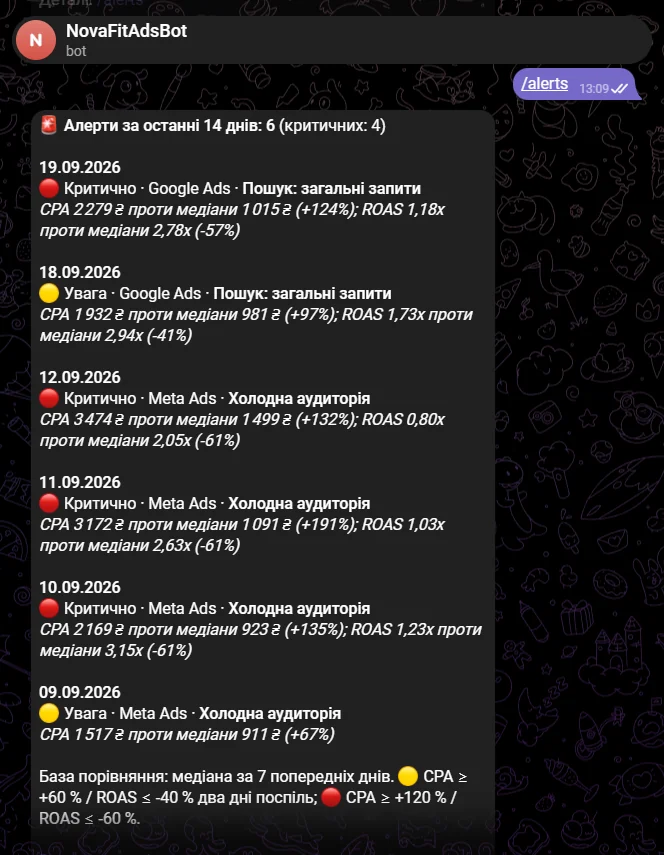
There are two thresholds. Warning - CPA 60 % above the median or ROAS 40 % below, and only if it holds for two days in a row: one bad day is not yet an incident. Critical - CPA 120 % above or ROAS 60 % below, fires immediately; zero conversions with spend is critical too. One alert per campaign per day: CPA is the primary metric, ROAS the secondary.
4. The Telegram bot
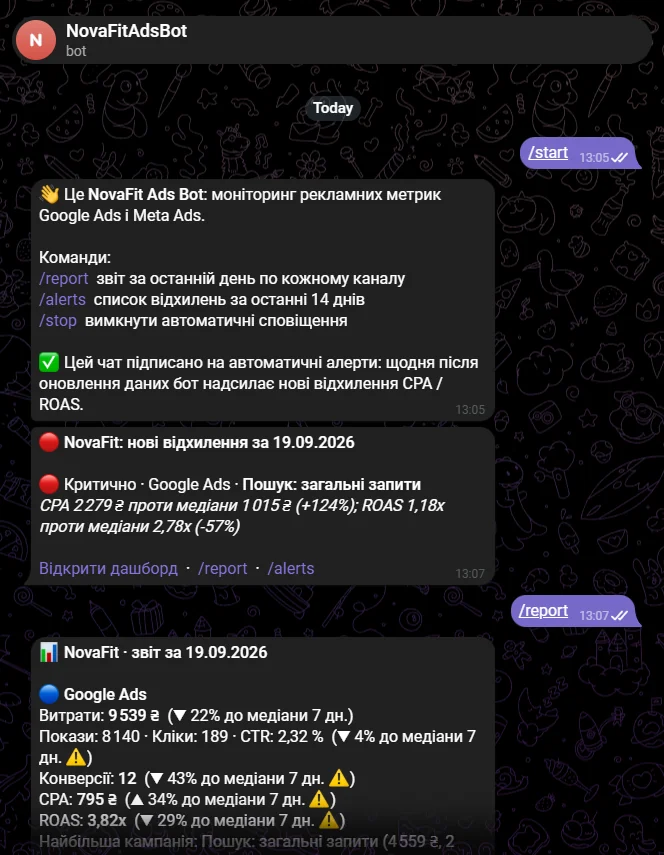
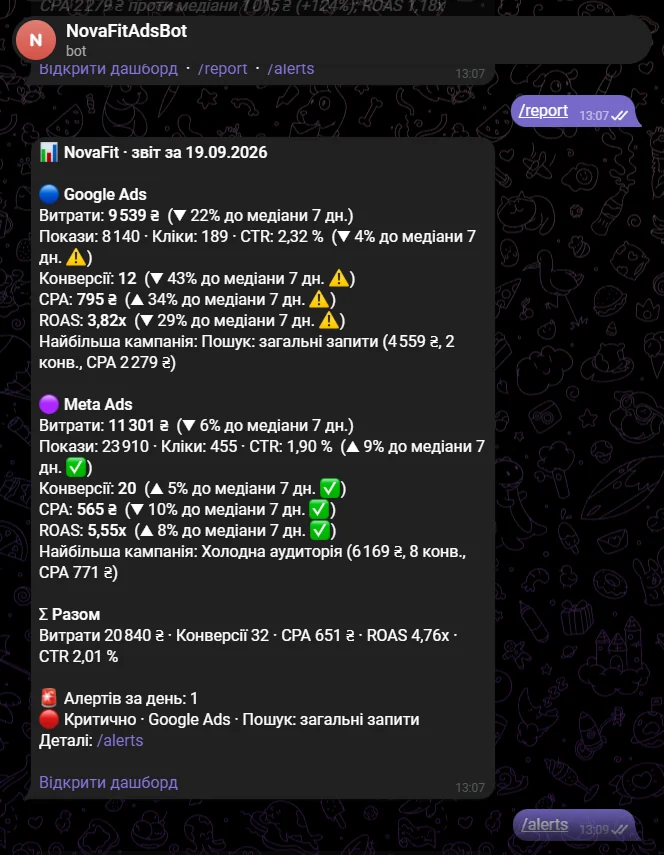
The bot is what the owner sees every day. After /start the chat is subscribed to alerts and receives them automatically after the morning update. /report shows yesterday’s summary per channel with ✅ and ⚠️ marks against the median, /alerts lists every anomaly from the last 14 days. Every message carries an
The logic that matters
- → The baseline is the 7-day median of each campaign on its own, not the account average: an expensive campaign cannot hide behind a cheap one
- → Two levels with different sensitivity: a warning needs a second day to confirm, a critical fires at once - less noise, yet nothing serious slips through
- → Deduplication by date and campaign: only new alerts are sent, a re-run never spams old ones
- → A Google Sheet instead of BI: no licences, the data stays in the client’s account, the formulas can be audited
- → Formulas are written in code in en_US syntax and translated to the sheet’s locale before writing - the sheet stays Ukrainian
- → Google Ads and Meta Ads behind one interface: the two API connectors are interchangeable, and a new channel is one more class with no changes elsewhere
What the system can do
- → Automatic daily metric pull from the Google Ads API and the Meta Marketing API at 09:00 Kyiv time
- → A Google Sheet dashboard laid out for 1920x1080: KPIs, channels, campaigns, four charts, recent alerts
- → Every metric compared with its 7-day median right in the KPI tiles and tables
- → A campaign status of normal or critical with the row highlighted
- → A data sheet with one row per campaign per day and formulas for revenue and the alert flag
- → Daily aggregates for Google, Meta and both on a separate sheet
- → An alert log with the level, metric, value, median, deviation and the time it was recorded
- → CPA and ROAS anomaly detection against a rolling median with two levels and a two-day rule for warnings
- → A Telegram bot: /report for yesterday by channel, /alerts for 14 days, subscribe and unsubscribe
- → Automatic delivery of new alerts only, after every refresh
- → A CLI for manual operations: load history, add a day, check, send