MarginTracker - a margin report from three CRMs and Nova Poshta
MarginTracker is a Windows app that does in one pass what used to take working days. It collects orders from the two CRM systems the online stores feed into, fills in product cost, pulls the shipping cost of every return out of Nova Poshta, and writes the finished report into a Google Sheet - one row per store plus a grand total.
Who it fits: product businesses running several stores whose orders live in different CRMs, where some parcels come back and the margin is still pieced together in Excel by hand. The more orders a month, the more the manual work costs - and the more an avoided mistake is worth.
Stack: Python 3, CustomTkinter for the interface, requests for the APIs, openpyxl for the local cost storage, gspread and google-auth for writing to the sheet. Packaged into a single exe with PyInstaller - nothing to install on the client’s machine.
- Python 3
- CustomTkinter
- requests
- openpyxl
- gspread
- PyInstaller
The problem
The client is a product business running several online stores. Leads from landing pages fall into two different CRM systems, the goods travel with Nova Poshta and some parcels come back. To find out what the month actually earned, the report was assembled by hand: export the orders from each CRM, glue them together in Excel, fill in the cost and work out separately how much the returns ate. For a few thousand orders that took working days, and every number carried over by hand was a chance to slip.
The hard part is not the arithmetic. It is that the data has to be collected from three different APIs with different limits, that the same product and the same store are spelled differently in each of them, and that the cost of return shipping exists neither in the CRM nor in any report the carrier provides.
How it works
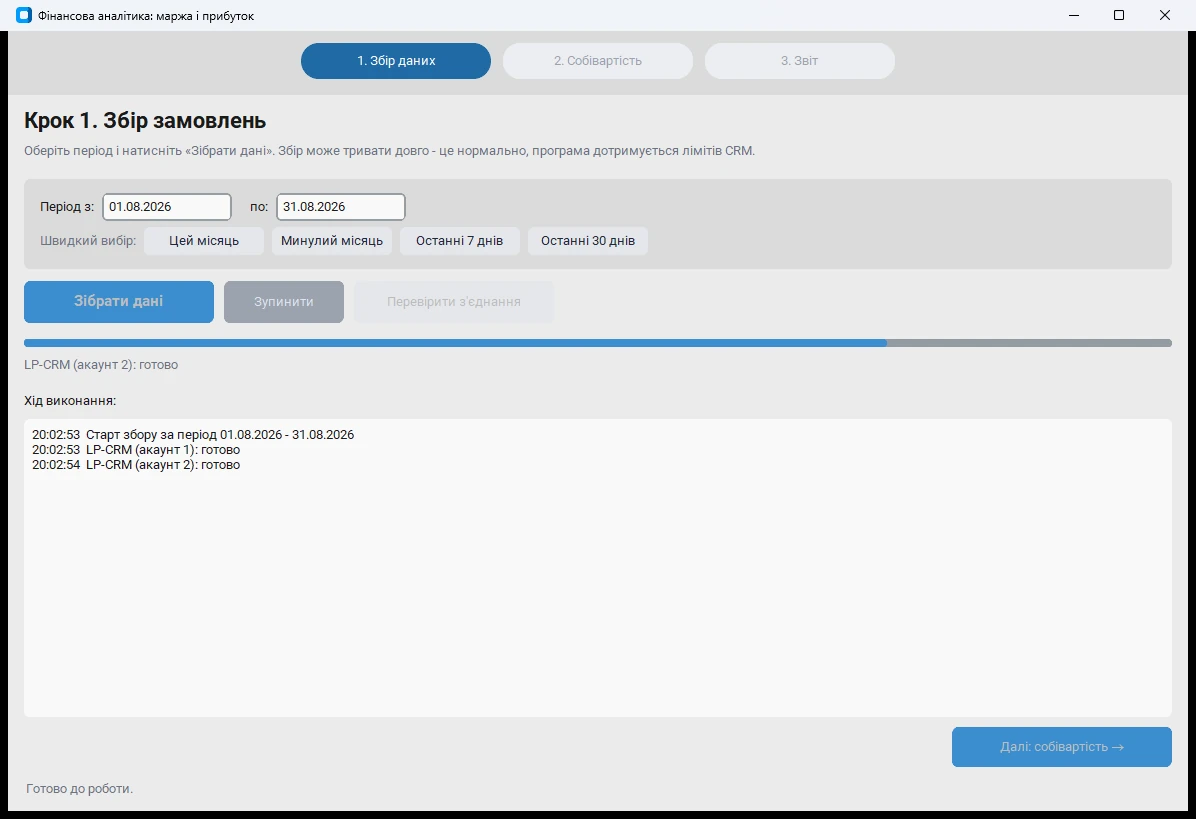
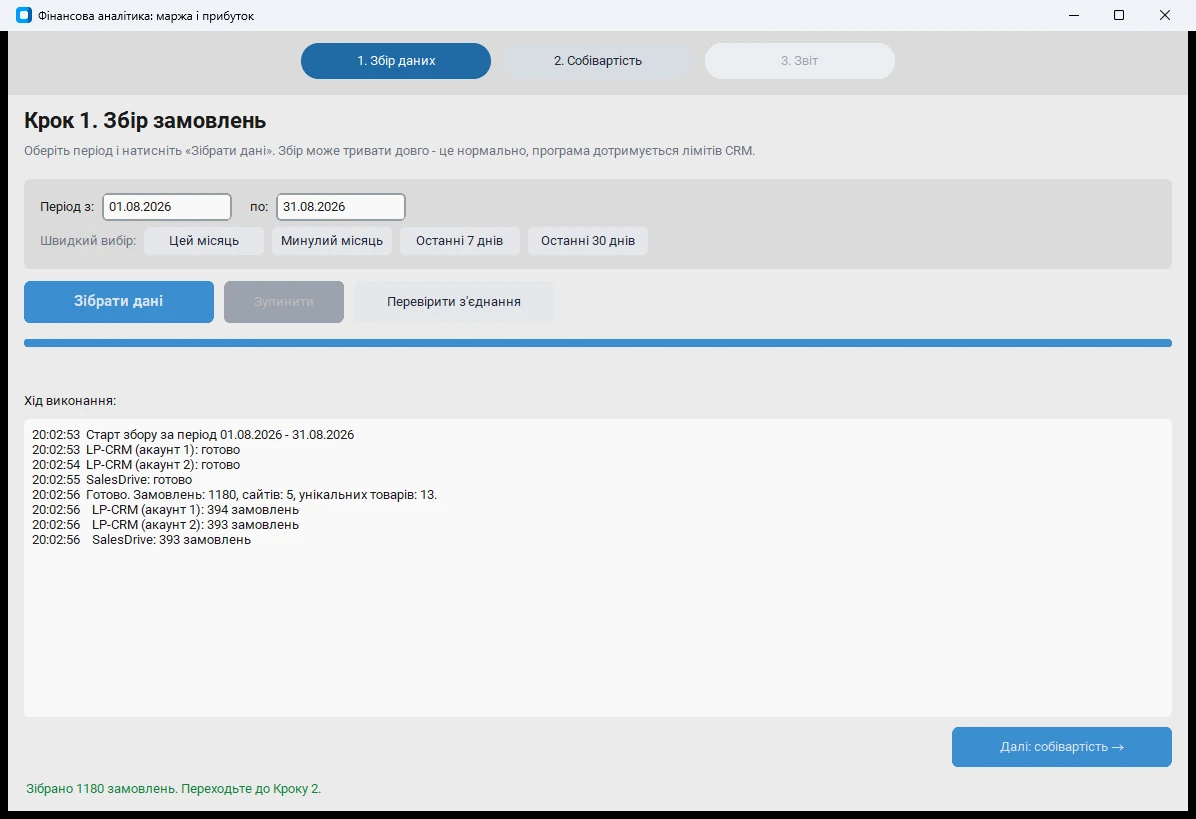
The app walks the user through three steps, and you cannot move on before the current one is done. Collect - cost - report. Everything runs locally in a desktop window: a single exe built with PyInstaller, nothing to install.
Every figure, store, product and number in the screenshots below is invented. This is the app’s demo mode, where all three steps can be walked through without a single API key: the interface and the calculations are real, the data was generated for this portfolio and has nothing to do with the client’s own.
1. Collecting the orders
The user picks a period and presses
2. Product cost
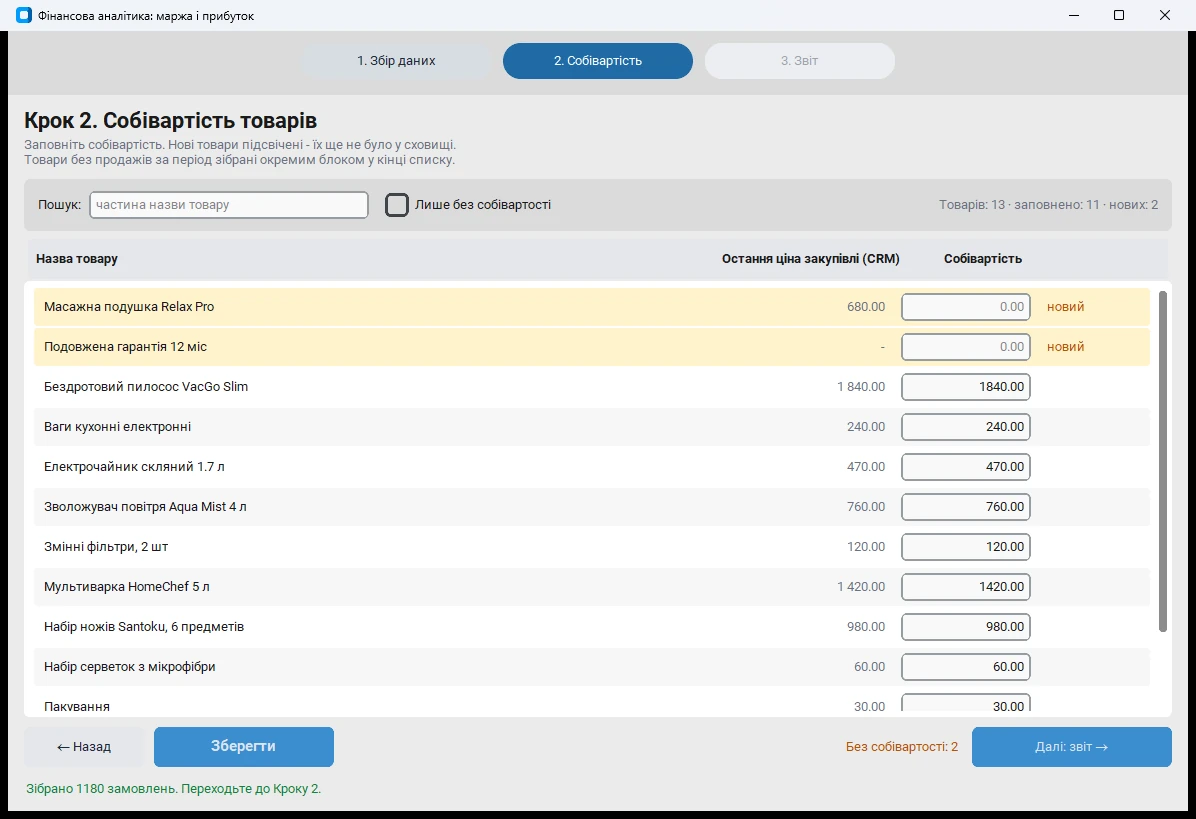
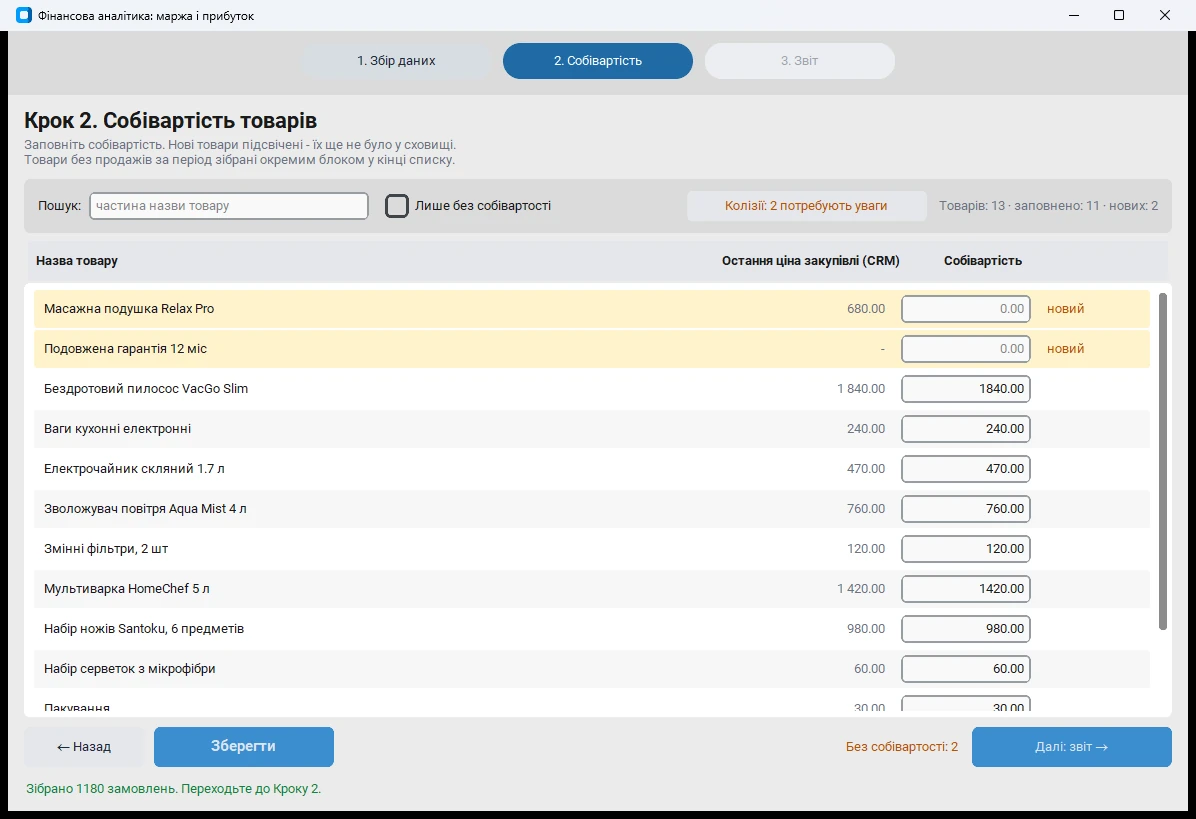
The second step is an editable table of every product in the period. Whatever was filled in last month is pre-filled; new items are highlighted yellow so they cannot be missed. The entered prices go into a local xlsx and survive between runs, and writes to the local files are atomic: an interruption halfway through does not corrupt the storage.
3. The report
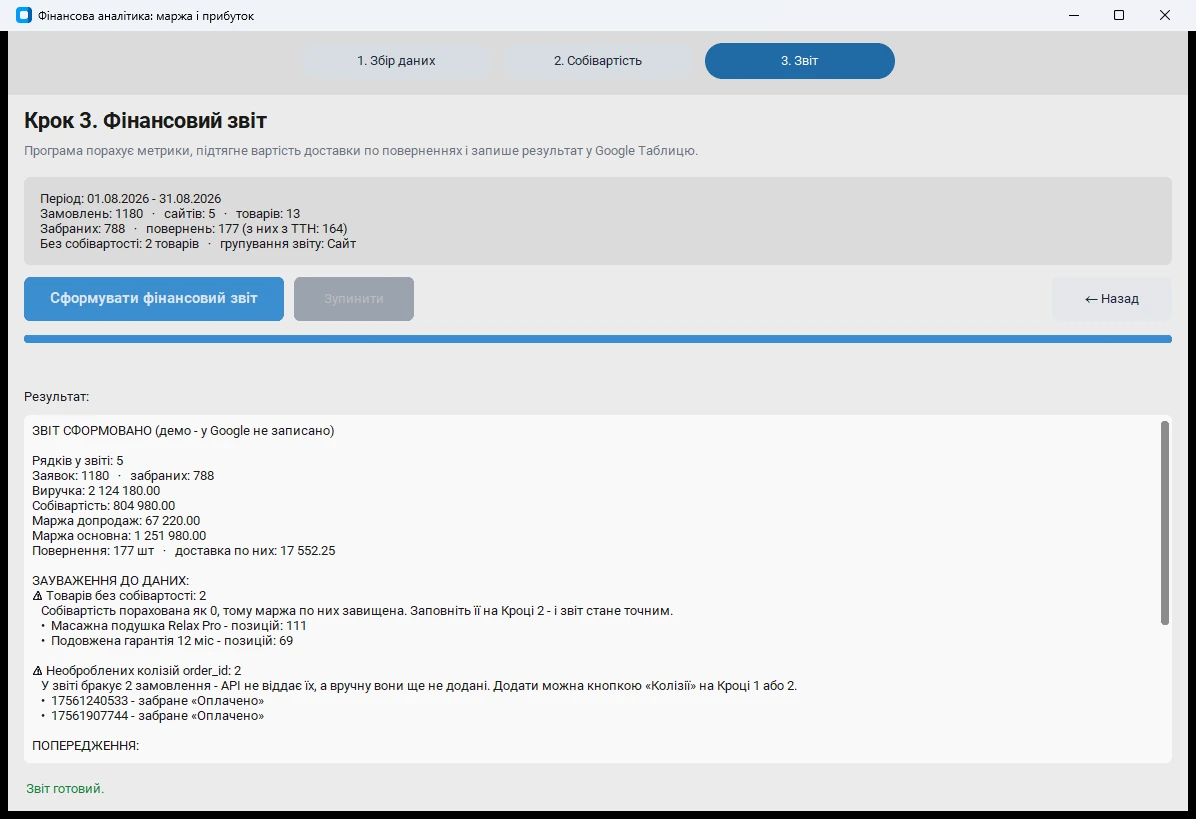
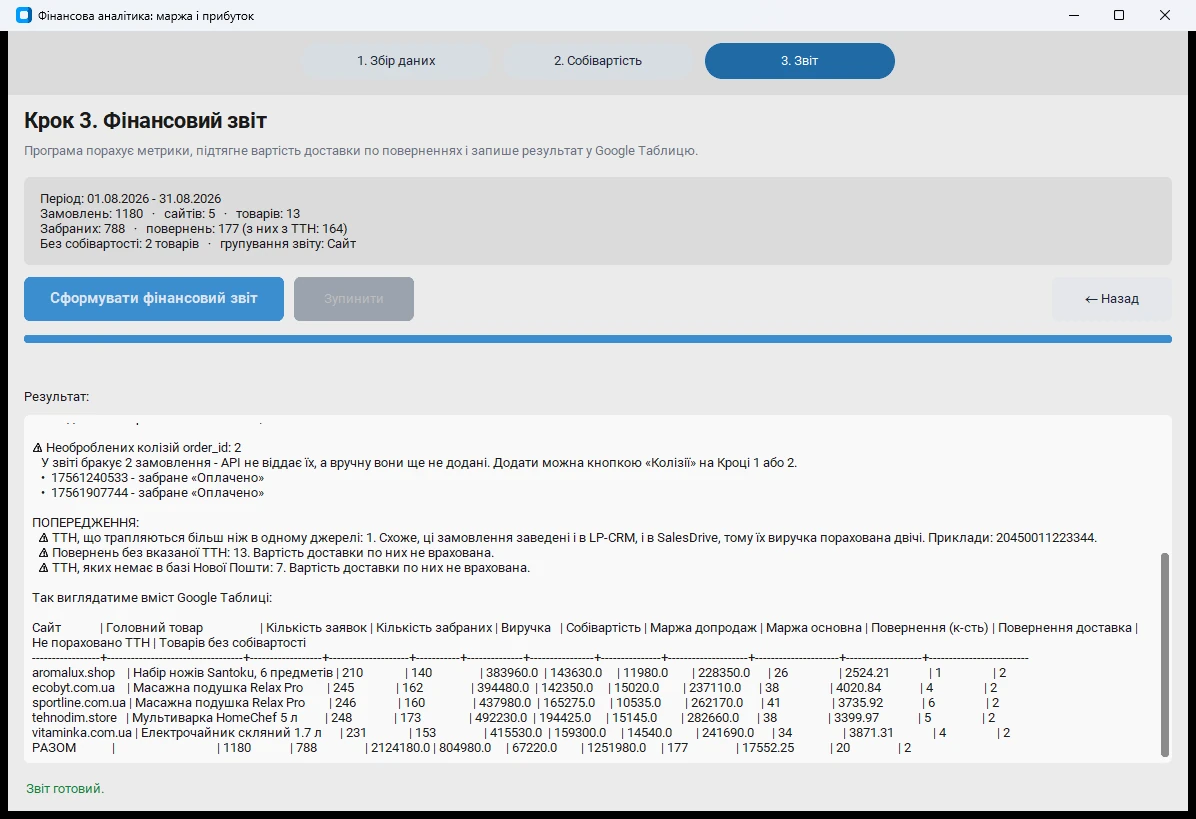
On the third step the app calculates the metrics, pulls in the delivery cost of the returns and shows the exact content that will go into the sheet. One row per store plus a grand total: the number of leads and of collected orders, revenue, cost, upsell margin, main margin, the number of returns and their delivery cost, plus how many waybills went uncounted and how many products are still missing a cost.
The margin is split in two on purpose. Advertising sells the main product, the operator sells the upsell - for the business these are different money and they are looked at separately. Order statuses are folded into three groups through a config: successful ones go into revenue, returns are counted separately, the rest is deliberately ignored. A status that belongs to no group breaks nothing: the app finishes the report and lists the new statuses as a separate remark.
Writing into the Google Sheet goes through a service account and in batches - a few requests for the whole report rather than row by row, otherwise you hit the API quota. The sheet can be created fresh every month or appended to.
Two problems the API documentation does not mention
The most valuable part of this project is not the interface. It is two things with no API method and no line of documentation behind them, which had to be worked out from scratch.
Disappearing orders: order_id collisions
The symptom: the client kept saying a few orders were missing from the report every month. Going through the logs showed the CRM API really did return fewer records than it was asked for.
The cause turned out to be the number generator on the landing page: the number is built from the timestamp down to a tenth of a second. Two orders placed within the same tenth of a second get the same number, and the API returns only one of them. Worse - inside a batch of a hundred numbers such an order deterministically eats one more record, the largest number in the batch, because of how the CRM limits the selection after joining its tables.
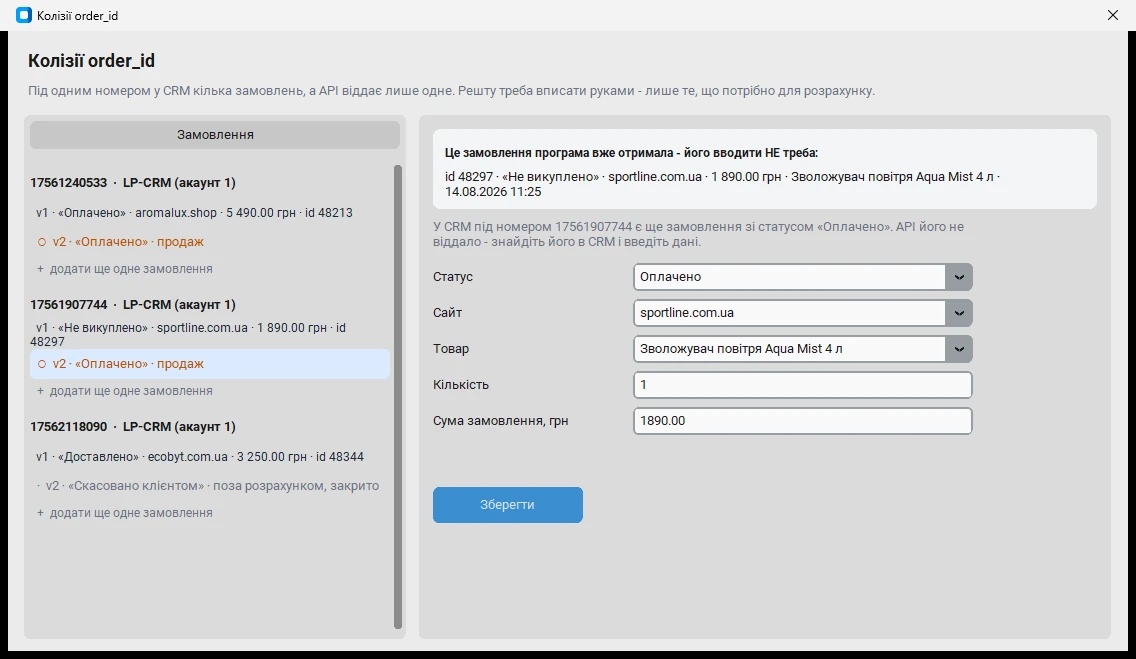
What was done. The eaten record is caught by repeating the request in smaller batches. For genuine duplicates there is a manual stage: the app works out how many orders live under one number and opens a window where the manager types in what the API withheld. What is typed is kept forever and reused in later runs - but only while the collision is still there, the missing order’s status still matches and the API still returns the same order as it did when the form was filled. If any of that changed, the record is set aside and shown to the manager again instead of quietly reusing a stale figure. The cause was passed back to the client: on some of the landing pages the number generator already adds a random suffix, and there the collision count is exactly zero.
The cost of return shipping
The CRM does not hold this figure at all, and the carrier exposes it through no dedicated method. Three places were checked: the return requests, the list of own waybills and the price calculator. In the first two the cost field is empty, the third does not accept a waybill number.
The scheme that works is this: the cost sits in the waybill card, and the full price of a return is the outbound leg plus the return leg plus the paid storage at the branch, which starts after seven free days. The carrier’s dashboard shows that storage on both waybills, so it has to be counted once per parcel or the sum doubles. The scheme was reconciled against a control sample of waybills down to the kopeck.
The app does not pretend the data is clean
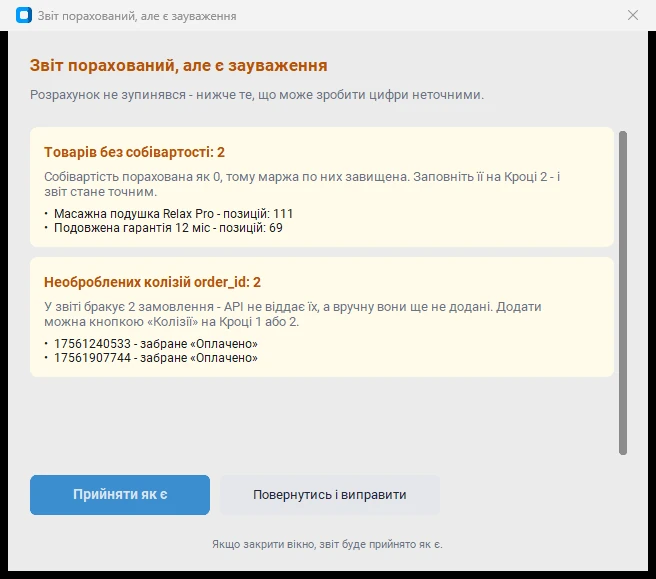
Before writing the report the app shows whatever could make the figures inaccurate: products without a cost, orders without products, returns with no waybill or with one the carrier does not know, the same waybill on two orders, new statuses, unfilled collisions. The calculation does not stop - you can look at the examples, accept them as they are, or go back and fix them.
The reasoning is simple: a report over a few thousand orders is either right or worthless. So the user should see exactly where a number may be off, rather than get a silent
The logic that matters
- → Manual collision entries are re-validated on every run: if the status or the API response changed, the entry is set aside and shown to a human instead of being reused silently
- → Paid storage at the branch is counted once per parcel even though the carrier shows it on both waybills - otherwise the cost of a return doubles
- → The margin is split into main and upsell: different people generate them, so they are looked at separately
- → An unknown order status does not break the calculation - the report is finished and the new statuses go into the remarks
- → Writing to the Google Sheet is batched: a few requests for the whole report instead of row by row, otherwise the API quota bites
- → Atomic writes to the local files: an interruption mid-save does not corrupt the cost storage or the manual entries
- → API errors reach the user in plain language rather than as a traceback, and the request is retried after a pause
What the app can do
- → Collecting a period’s orders from two CRM systems - two LP-CRM accounts and SalesDrive - in one pass
- → Respecting request limits with pauses and a check on the remaining quota
- → Mapping custom order fields through a config, to the names of the specific account
- → An editable cost table with search, a missing-only filter and new products highlighted
- → Carrying cost between months: whatever was filled in before is applied automatically
- → A manual stage for order_id collisions, with the entries re-validated on every later run
- → Calculating the delivery cost of every return from the Nova Poshta waybills
- → A financial report per store and in total, with the margin split and the full return statistics
- → Data remarks before writing - with examples and a choice between accepting them and fixing them
- → Writing into a formatted Google Sheet: a fresh sheet every month or an append to an existing one
- → A demo mode: all three steps can be walked through on generated data without a single API key
- → An in-house self-test suite of 354 checks, run with a single command, that catches regressions in the calculations, the status mapping and the manual-entry logic